 |
||
|
|
SQL Server Profiler - Analyzing the databaseWhat is Microsoft SQL Server and what is SQL Server Profiler? What does it have to offer?Microsoft SQL Server is a powerful database management system, as many of us know. Those of us who have worked with SQL Server know that this product, as many other products of this type, make our lives as information technology professionals so much easier than it would be without it. Without the power it offers us, how would we manage to do the work that it performs in the background in as much time? However, in order to tap into the power of SQL Server, the interaction with the database must be done correctly and the objects residing in the database must be correct as well. Any component used by an application on the server must be correct and accessed correctly. What happens when the tools we are using to access the database and something in the database are not exactly working as we expected? How do we go about determining where the problem is? SQL Server Profiler is one tool that can be used to provide a wealth of information that can be used in order to diagnose a problem or error in our application. What is Profiler? Profiler is a utility that runs on the server that monitors and logs specified activities on the server in order to produce a listing of all the activity occurring on the server. SQL Server Profiler is configured by the user to capture the events that they want to monitor. This allows the user to create a customizable view each time that they have an issue they want to watch. This is done by the use of a trace running on the server that is configured to capture the data deemed necessary by the developer or administrator in order to determine where the problem may be. To run Profiler from Enterprise Manager, select the SQL Server Profiler option from the Tools menu as shown in the image below: 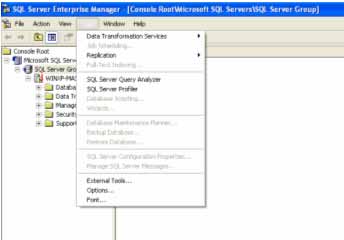 Once the SQL Server Profiler option is selected, the following screen will open for the user to interact with the utility and configure the trace that may be needed at the time. This screen has many options available that can be used to configure the trace running on the server. This article will focus on setting up a trace in order to diagnose a problem on the server or to monitor an event that might be returning questionable results. 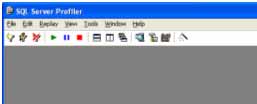 In order to configure a new trace select File | New | Trace from the menu options available on the screen. See the following image for an illustration of the menu options needed to open a new trace. 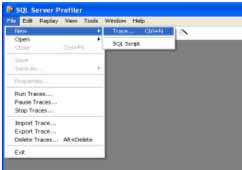 Once this option is selected, the interface will open a screen that will allow the user to connect to the server in question. Once successfully connected to the server, it is time to configure the trace that will run on the server. The configuration screen is shown in the following graphic: 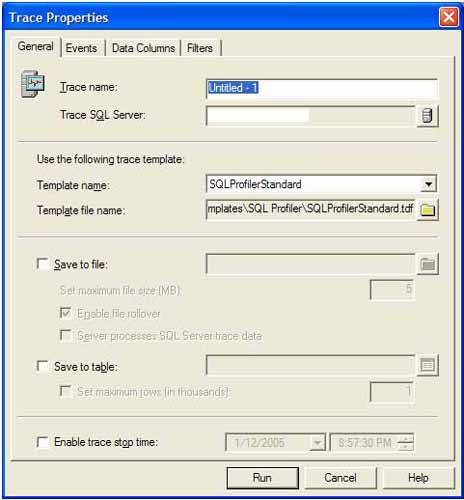 The configuration screen consists of four tabs, the General tab is illustrated above. This tab is used to give the trace a name and select the SQL Server that the trace will run against. If a trace template exists that has already been configured, it can be selected in the Use the following trace template section. The option exists to save the trace results to file or to a table. Either of these options will instruct the server where to save the results of the trace so they can be retrieved later. Each option allows the user to regulate the amount of rows that Profiler will capture during the trace. If the user would like the trace to stop automatically, a date and time can be selected for the server to stop the trace automatically. This can be advantageous if you have many windows open and do not want a lot of activity logged from a very busy server by not letting the trace run for a long time. The next tab is the Events tab. This tab is shown below: 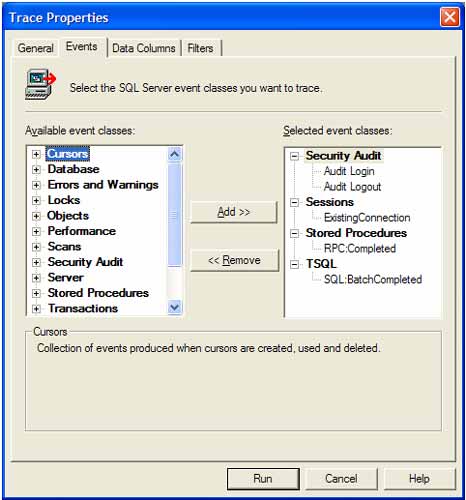 This tab allows the addition or removal of events that occur on the server that are to be traced by the server. There are numerous events available that can be used depending on the information needing to be traced by the user. Each of these events will be logged by SQL Server Profiler as a different type of event so that the results can be searched easily by the type of event that occurred. The next tab is the Data Columns tab. This tab is shown in the following graphic: 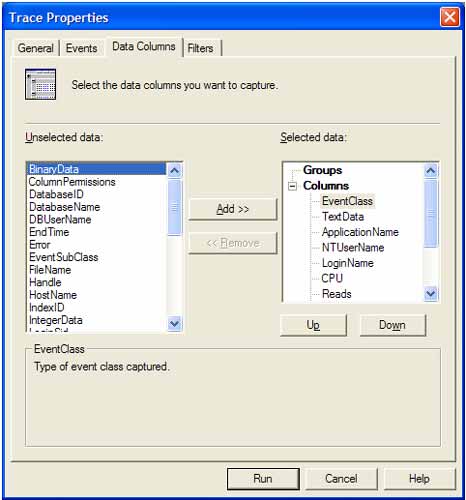 This tab is used to instruct the server which data to capture in SQL Server Profiler. Some common elements are ApplicationName, which is the name of the application that called the event, the TextData, which is the instruction as seen by the server, the DatabaseName, which is the name of the database being accessed by the statement and Duration, which is the length of time needed to process the statement. This field can be particularly useful in diagnosing a long running statement in a stored procedure. The final tab is the Filters tab. This tab is shown in the following graphic: 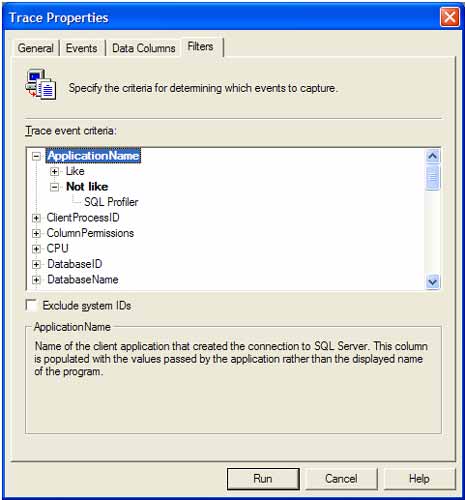 This tab will allow the user to configure any filters that they would like to apply to the trace in SQL Server Profiler. This can restrict the amount of data going into the trace. For example, if a particular database is needed, set the DatabaseName field to the desired database name. Once all of the options are configured, click the Run button in order to run the trace. The trace screen is shown in the following image: 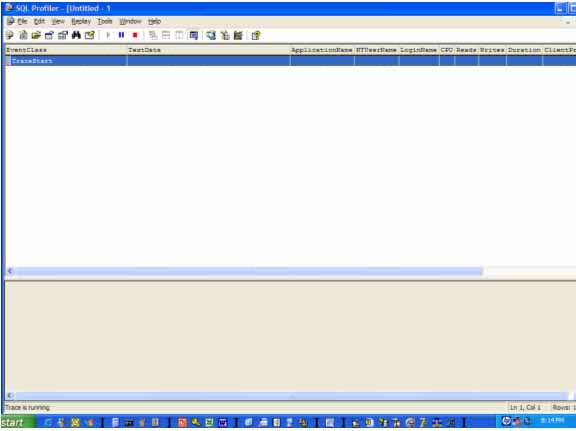 To stop the trace, select the red square button on the toolbar. If the results were saved to a table, the table can be accessed just like any other table in SQL Server. By analyzing the results of the trace, the user can see what activity is taking on the server and in what order when they are making calls to the database, which can be a powerful when trying to debug a problem that may be occurring or returning unexpected results. |
Exclusive interviews with:
Free eBookSubscribe to my newsletter and get my ebook on Entity Relationship Modeling Principles as a free gift: What visitors say...
"I just stumbled accross your site looking for some normalization theory and I have to say it is fantastic.
Read more
Testimonials
I have been in the database field for 10+ years and I have never before come across such a useful site. Thank you for taking the time to put this site together." Mike, USA |
|
Theory & Practice DB Normalization Analysis Phase Database Keys DB Glossary Appl.Architecture Oracle DBA MySQL DBA SQL Server DBA Install Oracle Install SQL Server Proj.Management Oracle Constraint Programming Tips Database Normalization eBook: |
||
|
Copyright © www.databasedesign-resource.com /
All rights reserved. All information contained on this website is for informational purposes only. Disclaimer: www.databasedesign-resource.com does not warrant any company, product, service or any content contained herein. Return to top
The name Oracle is a trademark of Oracle Corporation. |
||